Mapping Israel in R
I think I spent two or three days trying to map in R about 6 months ago, but I couldn’t find the shape files for Israel, even after visiting the University GIS lab.
Mainstreamish (/ComputerWorld/) news article linked today on g+
Found the shape files today. (Click Israel and Administrative areas)
Direct link So that can be added to your R script with curl or wget.
download.file("http://biogeo.ucdavis.edu/data/diva/adm/ISR_adm.zip",
              "~/Desktop/ISR_adm.zip")
unzip("~/Desktop/ISR_adm.zip", files=Sys.glob(".shp"),
      unzip="internal",       exdir = "./shapeFiles")
My script begins after downloading the shape file by hand.
First I went to maps.google.com and found Israel to get the latitude and longitude. I was modifying Ralph’s tutorial that showed the London Olympic Stadium in R. So, I copied the ggmap::getmap() syntax from there and changed the latitude an longitude.
library(maptools)
library(ggmap)
mapImageData3 <- get_map(location = c(lon = 35.1660235,
                                      lat = 31.32226),
                         color    = "color",
                         source   = "google",
                         maptype  = "satellite",
                         zoom     = 7)  ## 3 is spain to India big
                                        ## 16 is the Olympic stadium
                                        ## 6 is  Suez to Euphrates
                                        ## 7 works, but too wide
                                        ## 8 cuts off part of Golan
The next step is to read in the shape file, and set some colors for the shapes. Here I follow another tutorial.
## read the shape file         ;;  https://www.r-bloggers.com/shapefiles-in-r/
IsraelPolygon <- readShapePoly("/Users/tom/Downloads/ISR_adm/ISR_adm1.shp")
## make it graphable                   # or file.choose:
IsraelPoints <-fortify(IsraelPolygo    # area <- readShapePoly(file.choose())
## pick colors for areas
library(RColorBrewer)
colors <- brewer.pal(9, "BuGn")
Finally, I plot the shapes on top of the underlying satellite map.
ggmap(mapImageData3,
extent = "device",
ylab = "Latitude",
xlab = "Longitude") +
geom_polygon(aes(x=long,
y=lat,
group=group),
data=IsraelPoints,
color=colors[9],
fil= colors[6],
alpha=0.5) +
labs(x="Longitude",
y="Latitude")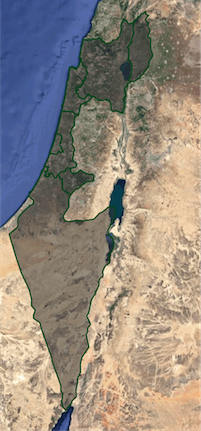 It still remains to match the areas to some useful data (birthrate, income, z-ness, rainfall . . . ) and produce a cloropleth.
All code for this post is available as a gist.
It still remains to match the areas to some useful data (birthrate, income, z-ness, rainfall . . . ) and produce a cloropleth.
All code for this post is available as a gist.